
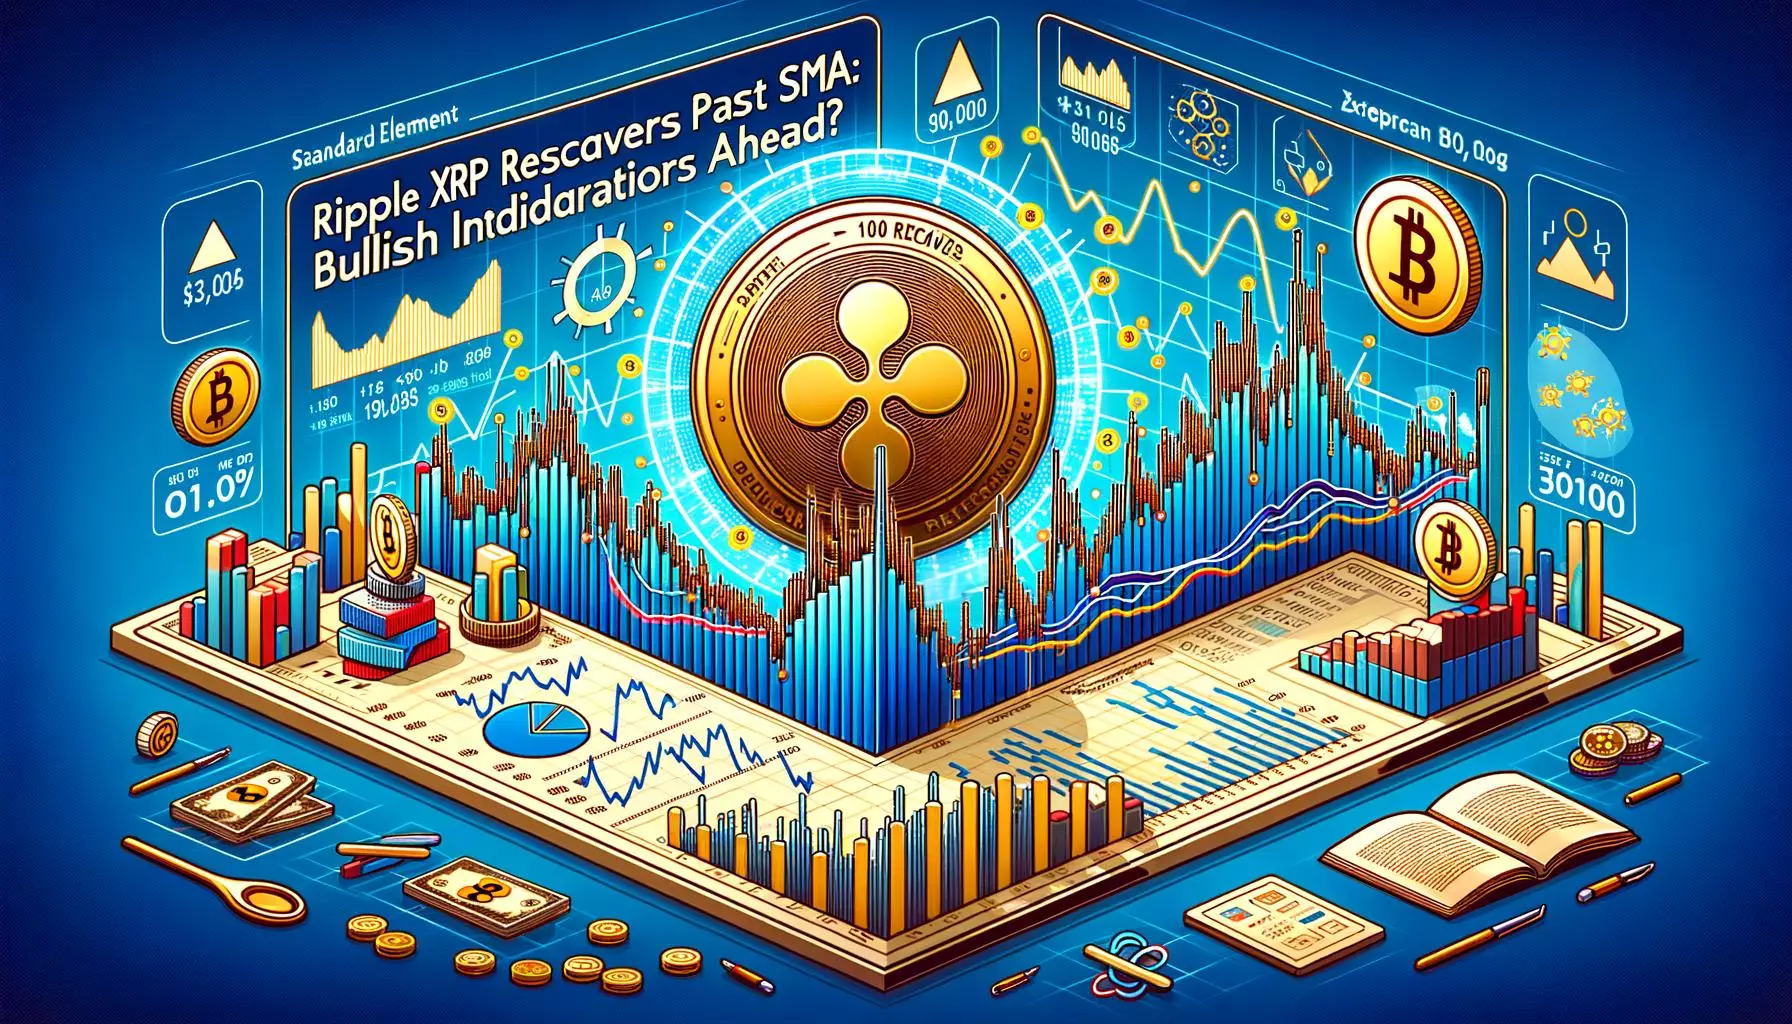
XRP price recently experienced a decent recovery wave, starting from the support level at $0.4600. The bulls managed to take a stand near this crucial level, leading to a significant upward movement. The price successfully reclaimed the 100-hourly Simple Moving Average and surged above $0.4850, indicating a potential for further gains in the near future.
One of the key indicators of the price surge was the breakout above a key bearish trend line resistance at $0.4860. This breakout signaled a shift in market sentiment, with buyers gaining control and pushing the price higher. The XRP/USD pair even spiked above the $0.5000 zone, reaching a high of $0.5049 before correcting gains.
Despite the bullish momentum, the price is currently facing resistance near the $0.4950 level, with the first key resistance at $0.4980. Further major resistance levels are seen at $0.5050 and $0.5250. A close above the $0.5050 resistance zone could potentially propel the price towards the $0.5320 and $0.5500 resistance levels.
On the downside, initial support is observed at the $0.4850 level and the 100-hourly Simple Moving Average. The next major support level is located at $0.4720. A break below this support level could indicate a bearish trend reversal, with the price potentially retesting the $0.4600 support in the near term.
The Hourly MACD for XRP/USD is currently showing an uptrend in the bullish zone, indicating a positive market sentiment and potential for further price gains. The Hourly RSI (Relative Strength Index) is also above the 50 level, reflecting a bullish momentum in the XRP market.
The recent price movement of XRP has shown signs of a recovery wave, with the price surging above key resistance levels and breaking out of bearish trend lines. While the bullish momentum is strong, it is important to watch out for key resistance and support levels for potential trend reversals. Traders and investors should closely monitor technical indicators such as the MACD and RSI for further insights into market trends and potential price movements.
Leave a Reply