
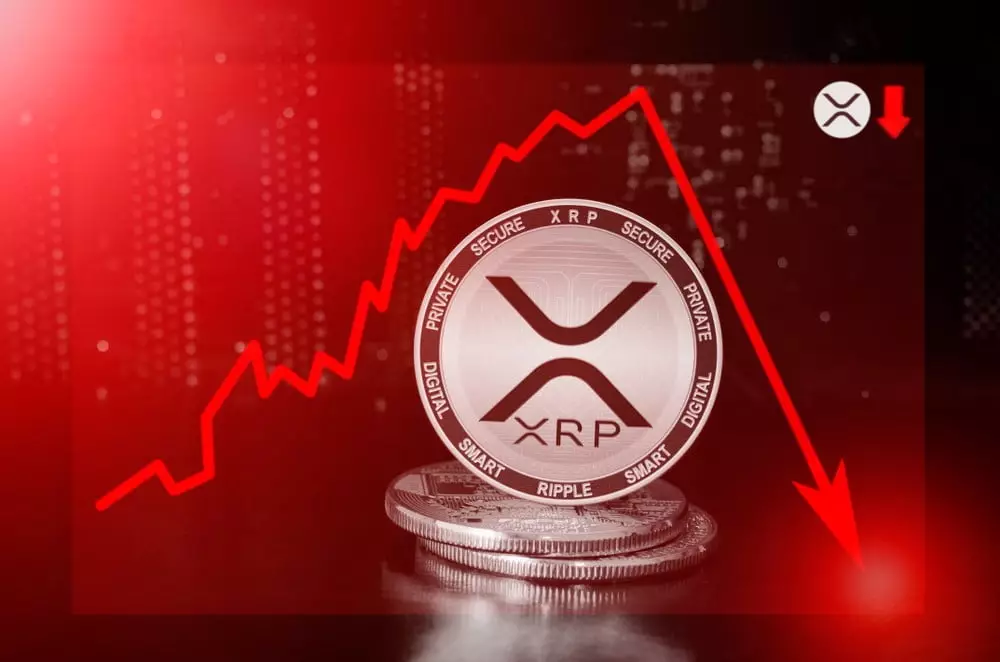
The XRP price is currently displaying bearish signals as it continues to trade below the $0.525 and $0.512 resistance levels. Additionally, it is trading below $0.520 and the 100 simple moving average (4-hour chart). This downward trend has prompted concerns that there may be a close below the $0.50 support level, which could result in further bearish momentum for XRP.
One key event that indicates the potential for a downward move is the break below a significant contracting triangle that had support at $0.5220 on the 4-hour chart of the XRP/USD pair sourced from Kraken. This break further solidifies the bearish sentiment surrounding XRP, making it vulnerable to more downsides below the $0.5000 support zone.
In contrast to Bitcoin and Ethereum, XRP has experienced heavy bearish movements below the $0.550 support level. The bears have remained active near the $0.5500 resistance, preventing any potential recovery waves. As a result, the XRP price has been subject to a steady decline, breaking below the key contracting triangle support mentioned earlier.
After a low was formed near $0.5012, the XRP price has entered a consolidation phase. As it looks to regain some positive momentum, immediate resistance lies near the $0.520 zone. This zone aligns with the 50% Fibonacci retracement level of the downward wave from the $0.5389 swing high to the $0.5012 low. Additionally, the $0.530 level and the 76.4% Fibonacci retracement level serve as key resistances. The XRP price could aim for the $0.5380 resistance level if these barriers are breached.
Should the XRP price manage to close above the $0.5380 resistance zone, it could trigger a robust increase in momentum. The subsequent important resistance level to watch would be around $0.5550, which, if surpassed, may lead to a rally towards the $0.5800 resistance. Additional gains might even propel the XRP price towards the $0.6000 resistance.
However, if XRP fails to clear the $0.5200 resistance zone, it is likely to continue its downward trajectory. Initial support can be found near the $0.502 zone, and should it fail to hold, the next major support level is at $0.500. A downside break and close below the $0.500 level could expedite XRP’s decline, potentially leading to a retest of the $0.450 support zone.
The MACD (Moving Average Convergence Divergence) on the 4-hour chart for XRP/USD indicates an increase in bearish momentum, with the MACD now situated in the bearish zone. Additionally, the RSI (Relative Strength Index) for XRP/USD is below the 50 level, further underscoring the bearish sentiment surrounding XRP.
The XRP price is facing bearish signs and may be poised for further downside as it trades below key resistance levels. The break below a contracting triangle support and the inability to clear the $0.5200 resistance zone all contribute to the current bearish sentiment. However, there is potential for a bullish resurgence if XRP finds sufficient support and manages to break through critical resistance levels. Traders are advised to conduct their own research and exercise caution when making investment decisions in the XRP market.
Leave a Reply